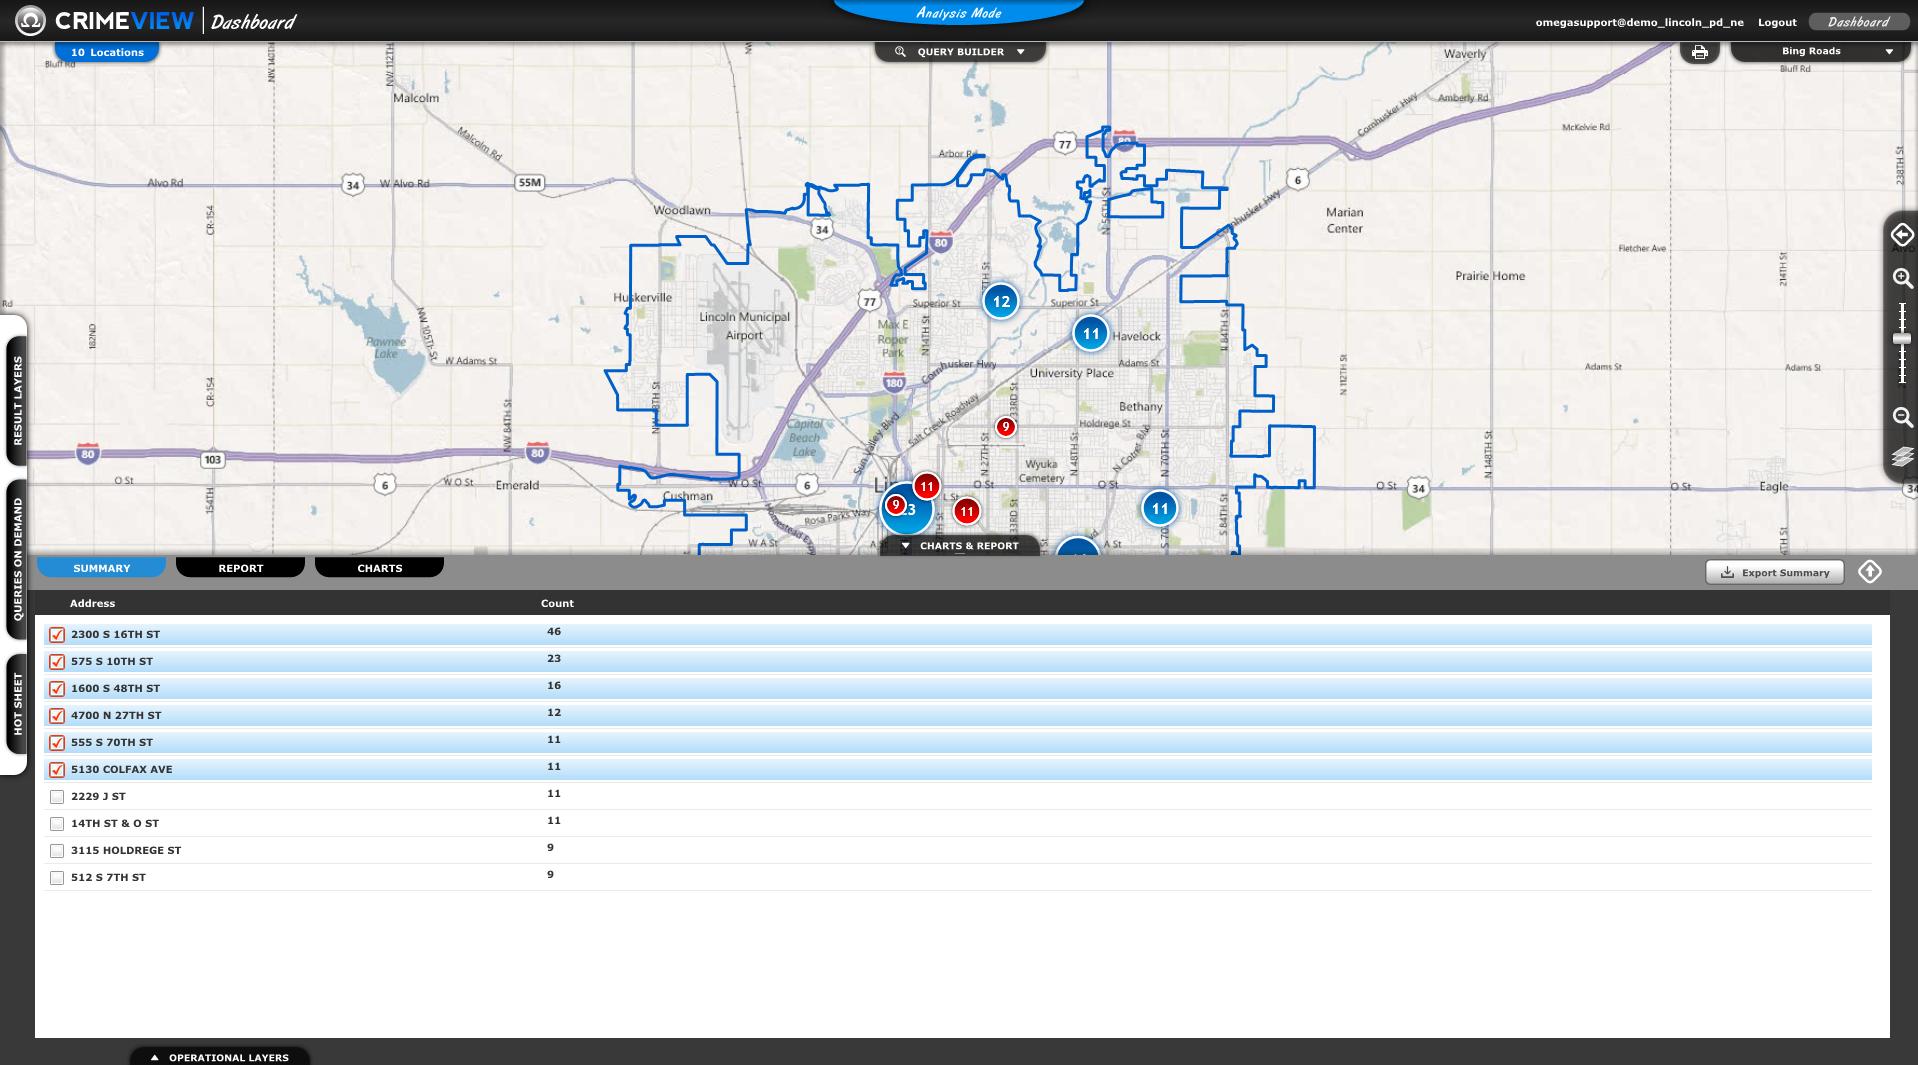
Repeat Locations Charts & Report Tab
Repeat Locations Charts & Report Tab
-
The Charts & Report tab for a Repeat Locations Result Layer has a Summary Tab, Report Tab and a Charts Tab.
Summary Tab
-
The Summary Tab shows the Address of each repeat location with the count of incidents at that location.
-
The Check Box will allow you to highlight that location on the map.
-
Highlighting a location also enables you to view the information about those incidents on the Report tab and the Charts tab.
Analysis Mode with a Repeat Locations Result Layer displayed and Charts & Report Tab expanded.
Report Tab
-
The Report Tab will show you detailed information about each incident at the repeat locations you have selected.
-
Each repeat location you selected will show on this tab. Clicking the arrow on each repeat location line will expand the repeat location and display information about each incident.
-
You will see information such as the Crime Code, Address, Comments, Report Date, etc.
Report Tab for Repeat Locations Result Layer
Charts Tab
-
The Charts Tab will display the data for the selected repeat locations in chart form.
-
The first chart displayed is a Pie Chart. The legend for the Pie Chart is also displayed below the Pie Chart.
-
The next chart displayed is a Day of Week chart.
-
The final chart displayed is a Time of Day charts.
Charts Tab for Repeat Locations Result Layer
Related Links:


