Omega Dashboard Help
Overview
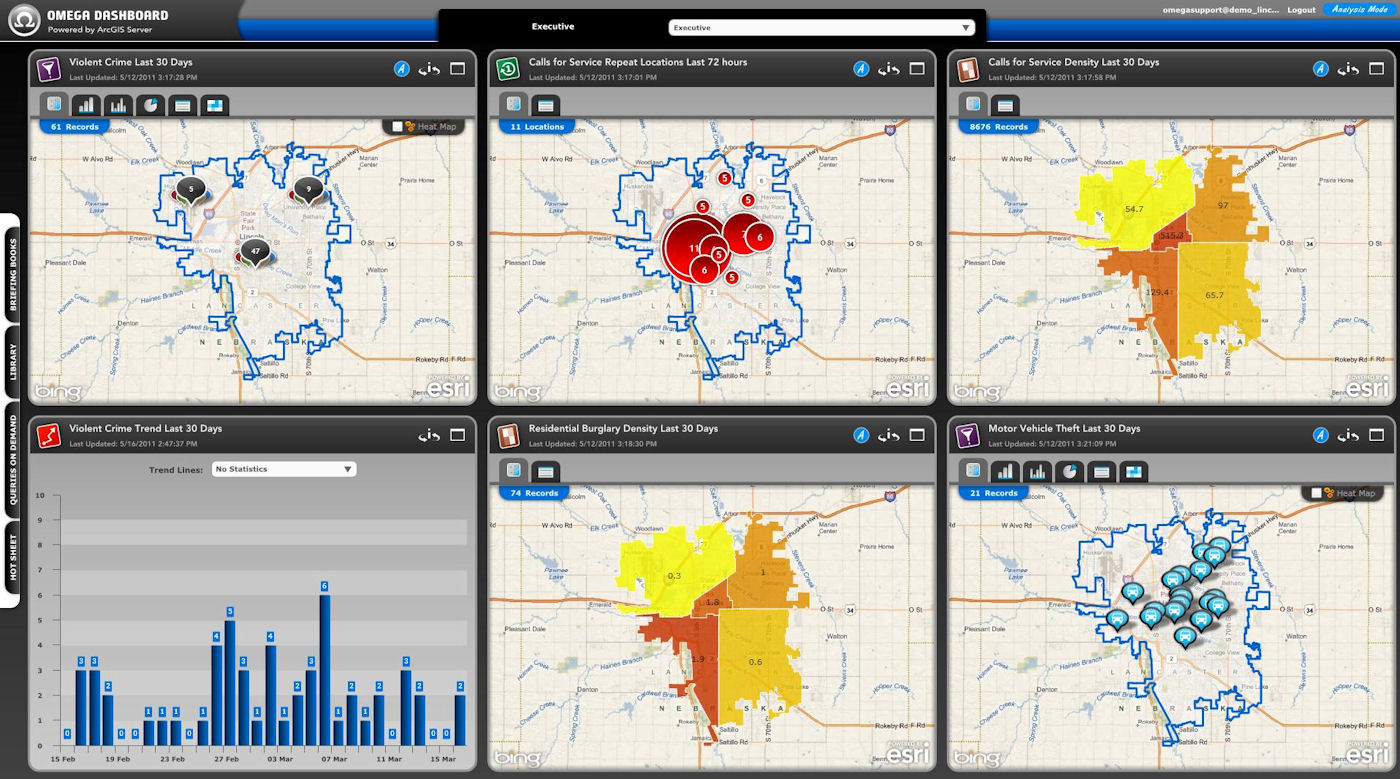
The Omega Dashboard is a comprehensive method for the organization and analysis of geographic information. There are two options within this application available for viewing and analyzing spatially referenced data; Dashboard Mode and Analysis Mode. There are two versions of the Omega Dashboard: CrimeView Dashboard and FireView Dashboard.
Dashboard Mode
Dashboard Mode provides a snapshot of GIS Information to quickly pick out patterns and trends in the underlying data. In this mode, queries are designed in advance to best represent the data of interest to the end user. Widgets are then built upon these queries to display the information using different visualization techniques. Maps, reports and charts are all used to allow the end user to quickly capture and view anomalous data that can then be further analyzed in Analysis Mode.
Analysis Mode
Analysis mode is a set of comprehensive data analysis tools that provides the ability to view and analyze pre-configured queries created by Designers and Administrators for the End User. Within Analysis mode, custom queries can be created by the End User to view any available data they wish, while a range of analytical tools can be applied to these queries to further analyze the results. While anyone can create a query in Analysis Mode, only those with the user type of Administrator, Designer or Standard may save them.
Designer Mode
Designer Mode is available to certain users with the User Type of Administrator or Designer. Designer Mode can be used to create content for the Dashboard. Designers can configure Widgets, Alerts or Queries and can organize this content they have created into available Briefing Books, Query on Demand groups and Alert Groups. Administrators are responsible for creating and managing Users and Roles, Briefing Books, Query on Demand groups and Alert Groups.
The Omega Dashboard
Related Links:
