![]()
![]()
Overview
The first tab you can view in the Minimized Response Time Widget is the View Map Tab.
This tab is open by default for Response Time Widgets and lets you quickly view a Response Time map for the pre-defined geographic boundaries.
The Second tab you can view in the Minimized Response Time Widget is the Table of Results tab.
The Table of Results tab will display legend and tabular information for the Response Time Widget.
View Map Tab
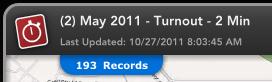
Record Count
You can see the count of records being displayed in the top left corner of the map.
Record Count
Panning and Zooming
There are three ways to zoom in on the Response Time Widget map in Minimized State.
To zoom into the map, left click the mouse, hold down the shift key, and drag the mouse to create a zoom window.
Another way to zoom into the map is to use the mouse wheel. Click on the map, and push the mouse wheel to zoom in.
A third way to zoom into the map is to double click on the map which will zoom the map one zoom level.
To zoom out of the map, click on the map, and pull the mouse wheel.
Map
On the map you can see the Response Time Map. Depending on the legend selected you can see Percentiles, Averages or Percents.
The Response Time Map will be broken up by the Geographic Boundaries that were set during Widget creation.
Response Time Widget Minimized State

Table of Results Tab
The second tab is the Table of Results tab.
This tab displays the legend for the Response Time Map.
You can see the Percentiles, Averages, Response Percents, the Count and the Name for each boundary on the map.
You can sort each column in either ascending or descending order by clicking on the Column Name.
Response Time Widget Table of Results Tab

Related Links: