Widget Overview
Overview
-
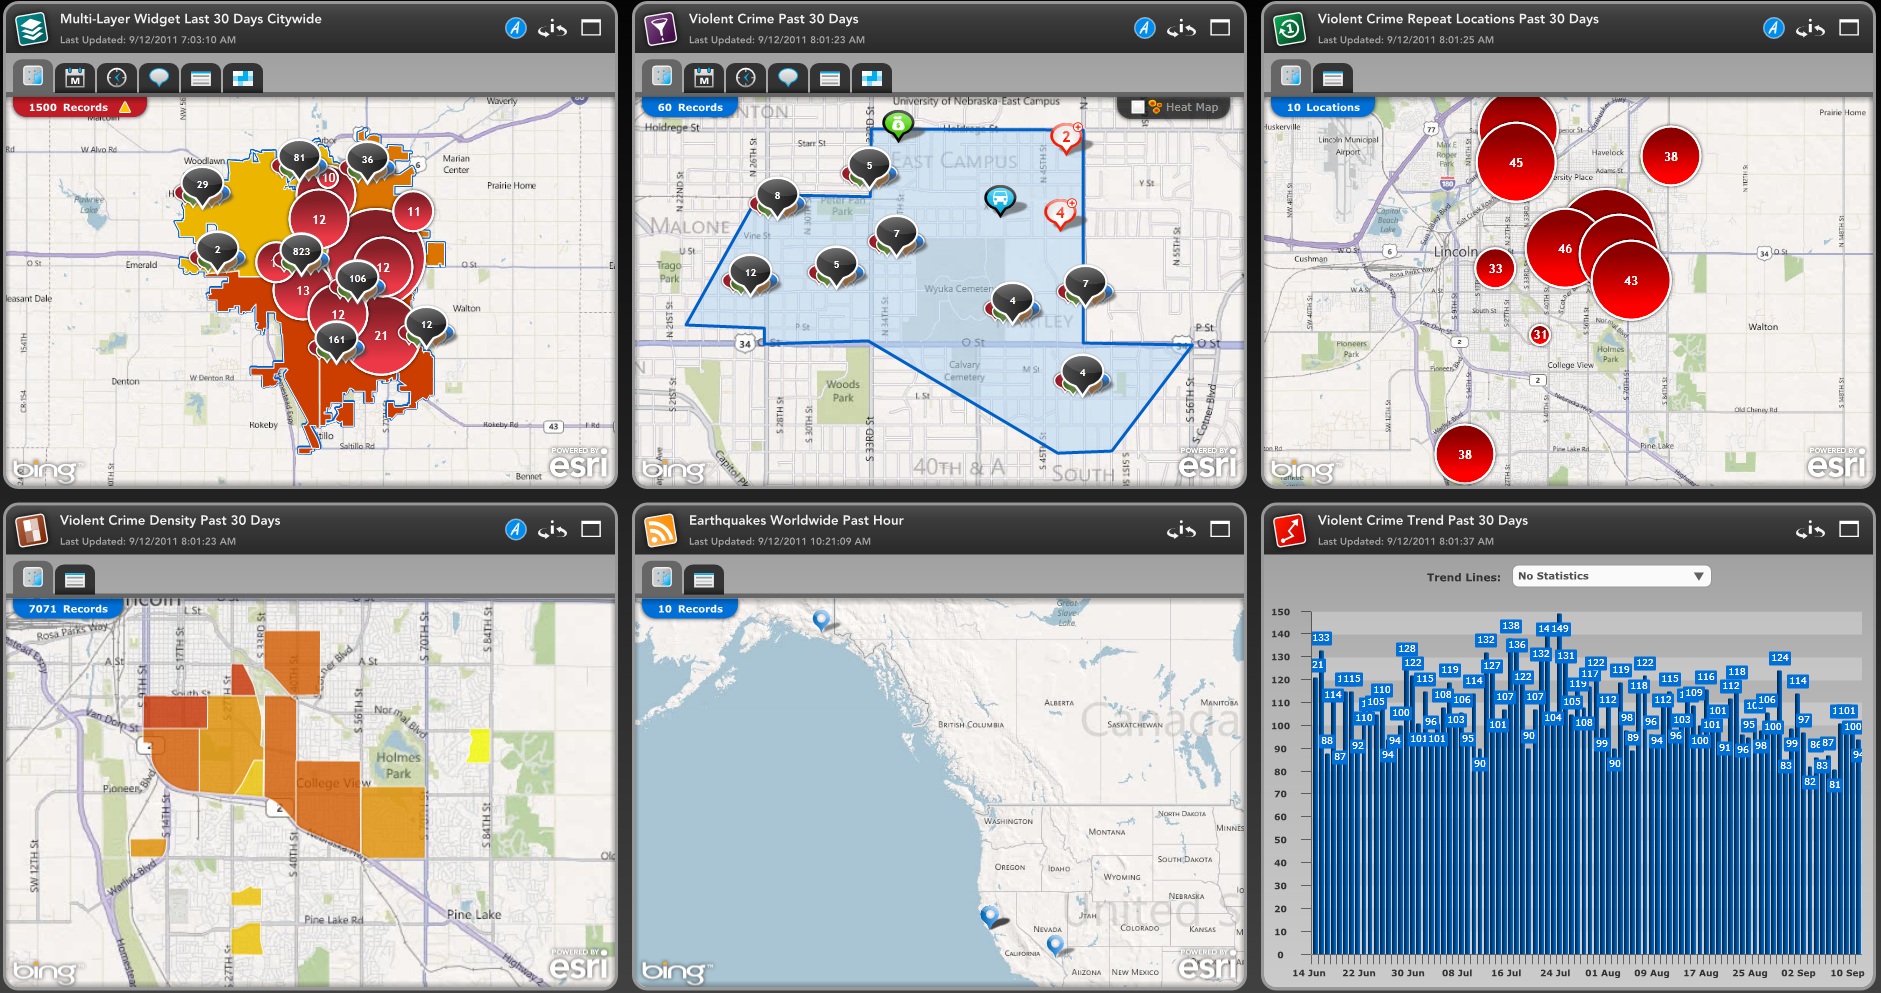
The Omega Dashboard displays data through the use of widgets. Widgets are created by Designers for end users of the Dashboard. There are currently five types of widgets in the Omega Dashboard: Filter Widget, Repeat Locations Widget, Density Widget, Trend Widget and GeoRSS Widget.
What is the purpose of a Widget?
-
A widget allows the end user to quickly view patterns or anomalies in the underlying data.
-
Different types of widgets are available in Dashboard Mode to present the data in the most appropriate manner.
-
Grouping widgets together can form a story to better understand the underlying data.
How does a Widget work?
-
A Widget is created by the Administrators or Designers of the application.
-
Each Widget is based on an underlying query of the data.
-
The Widget data can be presented as one of a number of different types of Widgets.
-
Widgets share a common framework which includes both information about the Widget and basic functionality in how the Widget operates within the Dashboard.
-
A Widget may be dragged to another location on the Dashboard by left-clicking the mouse on the Widget header, holding the mouse button down, and dragging the Widget across the screen.
-
A Widget may only be moved while in its Restored state.
Widgets in the Omega Dashboard. From left to right. Top row: Multi-Layer Widget, Filter Widget, Repeat Locations Widget. Bottom row: Density Widget, GeoRSS Widget, Trend Widget.
Related Links:
