![]()
Density Map Query
Overview
-
Density Map is the last choice in the Result Type drop down menu.
-
A density map query will display a density map for your selected incidents.
-
On the What tab you specify the type of incidents you would like to query for.
-
The Query Layers available to you will depend upon your Dashboard's configuration.
-
You can choose specific Saved Queries in each Query Layer by using the search bar or manually navigating through the Saved Queries using the arrows to expand them.
The What Tab.

-
The Where tab for a Density Map query can help you further refine the boundaries for the Density Map that you set on the Options tab.
-
Before choosing options on the Where tab, you should set your Density Map Boundary Layer on the Options tab.
-
Once you have Density Map Boundary Layer set, you can further refine on the Where tab by specifying a geographic boundary to search within.
-
You can use Within a Boundary or Within a User Created Boundary to further refine your Density Map. You can also Turn Off Search by Location.
-
You will also notice that the Near a Feature and Near an Address options are on the Where tab for a Density Map query. These options will have no effect on your Density Map.
Turn Off Search By Location
-
You can turn Search by Location off using the On/Off button on the top right of the Where tab.
-
Turning off Search by Location will allow you to search within the entire jurisdiction of your Agency.
-
You can turn Search by Location back on by clicking the On/Off button again.
-
When Search by Location is on, you can refine your search by various Geographic Boundaries. The specific Geographic Boundaries available to you will depend upon your Agency's Dashboard configuration.
The Where tab with Search by Location turned off.

Within a Boundary
-
Within a Boundary is the first way to further refine your Density Map.
-
You can choose to display the Density Map Boundary Layer you specified on the Options tab within geographic boundaries of your choice.
-
The Choose Geography Type drop down menu lets you choose a Geographic Boundary.
-
The check boxes next to each feature will let you choose which features you would like to use.
-
For example, if you set your Density Map Boundary Layer to be Reporting Districts on the Options tab, you can choose Center Team on the Where tab to display a Density Map for all Reporting Districts in the Center Team Jurisdiction.
The Where Tab with Within a Boundary selected.

Within a User Defined Boundary
-
The second option you have for refining your Density Map is Within a User Defined Boundary.
-
Here you can create your own boundary.
-
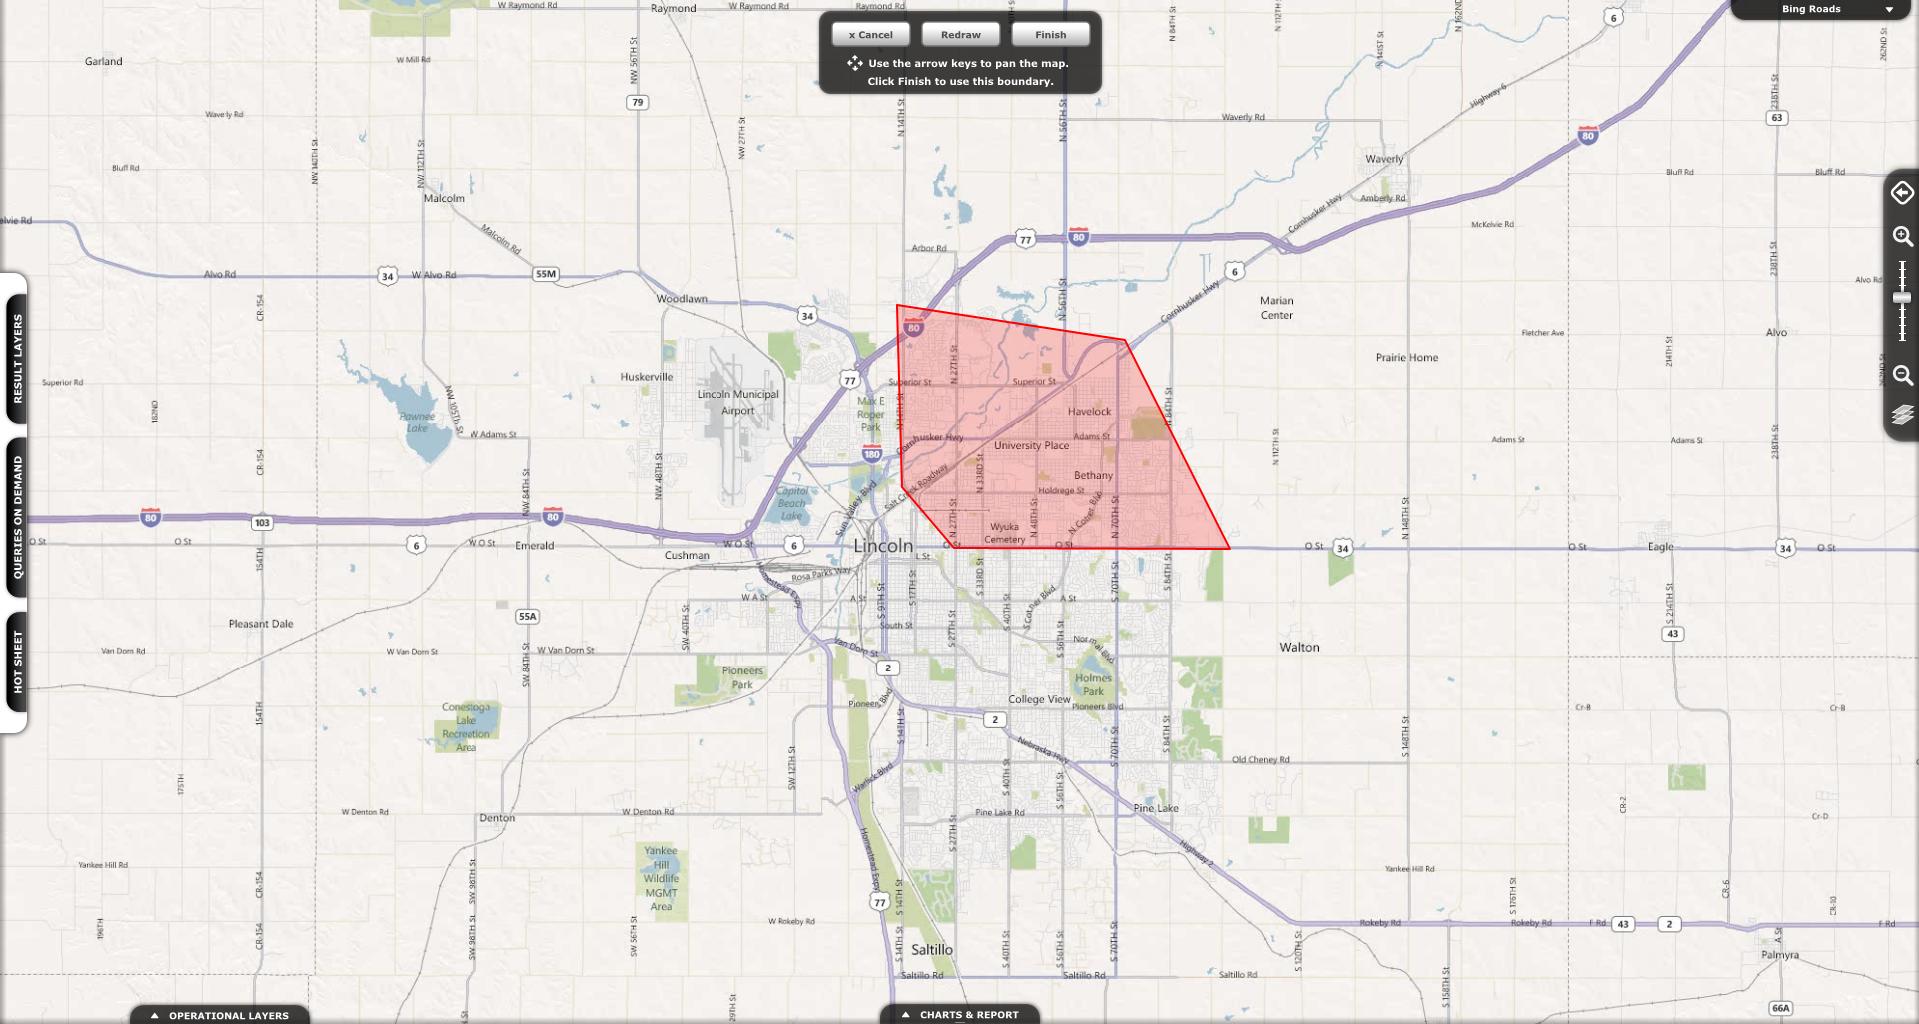
Clicking on the Create Boundary button will bring up the User Defined Boundary toolbar and take you to the map.
-
Zoom in to the area you would like to draw your geographic boundary around. You can pan the map using the arrow keys on your keyboard.
-
You can start making your boundary by clicking on the map. Your boundary will only be in the shape of a polygon.
-
When you are finished making your boundary, double click. You can then redraw your boundary, accept your boundary or cancel.
-
Your Density Map will then display the boundaries you selected on the Options tab within the Boundary you drew on the Where tab.
-
If the boundary you draw does not contain any features, you will receive an error message and will have to go back into the Where tab and draw a new boundary. You can turn operational layers on to help you draw a boundary around desired features.
Where Tab with Within a User Defined Boundary Selected.

A User Defined Boundary on the map with the menu visible at the top.
-
The When Tab allows you to specify the date and time range you would like to search for the selected incidents in.
Turn Off Search by Date/Time
-
You can turn Search by Date/Time on or off using the On/Off button in the top right corner of the tab.
-
Turning Off Search by Date/Time will return all Incidents from all days and times up to the max number of incidents that can be displayed on the map.
-
Turning On Search by Date/Time will allow you to refine your query by choosing certain days or times to only search for incidents within.
Date Time Group
-
-
This option allows the user to select which date field will be used when the features are selected. The options available will depend upon your Dashboard's configuration.
-
Predefined Date Range
-
-
This option includes predetermined date ranges for querying data.
-
Previous Duration
-
-
The previous duration option allows users to select a custom duration of time. The first box displays the duration of the time the user wants to query. The second box displays the units (hours, days, weeks, months) the user would to use in the query.
-
The calendar portion of this dialogue box displays the current date range the user has chosen. The calendar on the left side displays the start date and the calendar on the right displays the end date. The grey box displayed on both calendars is the current date.
-
Day of the Week Option
-
-
With this option the user can narrow the date range by the day of week the incidents occurred. This is done by selecting the day of week to filter by. It is also possible to select all days, only weekends or only weekdays by clicking the corresponding button.
-
Time Range
-
-
You can also filter by a time range. The predefined time range allows user to select incidents which occurred during the day hours (0600-1759) or night hours (1800-0559). The start time and end time box allow the user to select features in anytime range.
-
Range Type
-
-
The first option 'Use Hour Range Sliced Across Dates' selects features within a certain time period for each day of the date query. When a user selects a start time and an end time, the query will look for incidents within that time period for the date range queried. If the date range chosen is January 1st to January 7th, with a start time of 9am and an end time of 5pm, all incidents that occurred between 9am and 5pm on each day of the query will be selected.
-
The second option Use Start and End Time to Delimit Range sets the start time at the beginning of the date range, and the end time at the end of the date range. If the date range chosen is January 1st to January 7th, with a start time of 9am and an end time of 5pm, the output would be all incidents from January 1st at 9am to January 7th at 5pm.
-
The When Tab.

-
The Options Tab for Density Map queries contains two tabs to set options on: a Boundary Layer tab and a Legend Tab.
-
The Boundary Layer tab is open by default and lets you set the Boundary Layers you wish your Density Map to be broken up into.
-
The Boundary Selection method lets you choose to Use Spatial Filter, Select Features to Include or Select All Features.
-
Clicking on Use Spatial Filter brings up two more options. Are Within and Centroid now can be selected.
-
Clicking on Select Features to Include will allow you to select which features to include. Clicking on this will then display the features on the right side of the tab. You can use the check boxes to select features.
-
Clicking on Select All Features will use all features within your selected Boundary Layer.
-
You can further refine your choices here within the Where tab of the Query Builder.
The Options Tab with Boundary Layer tab displayed.

-
The second tab is the Legend Tab. The Legend Tab lets you set the options for the Density Map legend.
-
The Result Layer Name field lets you name the Result Layer.
-
The Transparency slider lets you set the transparency for the density map.
-
The Display By radio buttons let you chose to display by either Count or Density.
-
The Legend drop down menu lets you chose the color of the density map.
-
The Set # of Breaks drop drown lets you choose any number between 1 and 10.
The Options Tab with Legend Tab displayed.

Related Links:
© Copyright 2011 The Omega Group. All Rights Reserved.