Response Time Charts and Reports
Overview
-
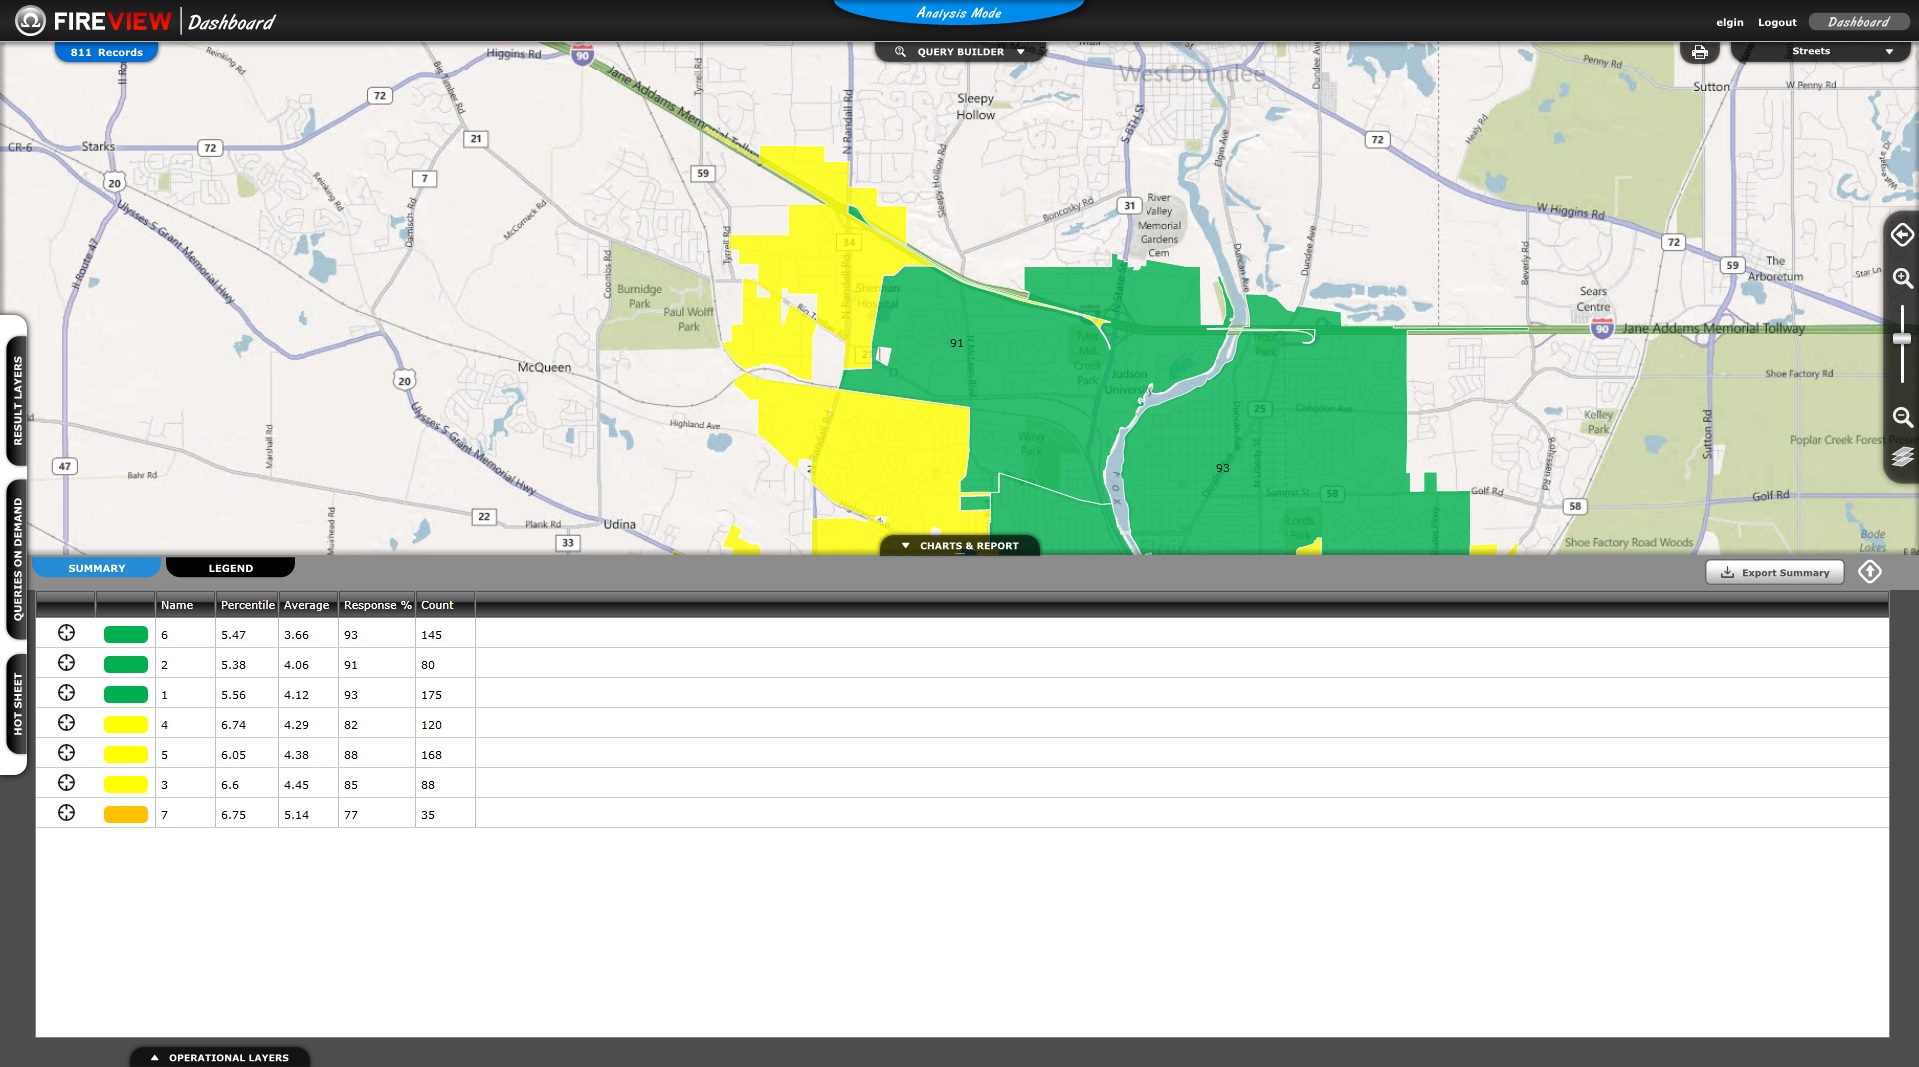
The Charts & Report tab for a Density Map Result Layer has a Summary tab and a Legend tab.
-
You can use these tabs to further analyze the results being presented in the Response Time Query.
Summary Tab
-
The Summary Tab displays summary information about the Response Time map.
-
Each color on the Response Time map is displayed, with its corresponding Geographic Boundary Name, Percentile, Average, Response Percentage and Count.
-
You can use the circular button to zoom to the corresponding boundary on the map.
Analysis Mode with a Density Map Result Layer displayed and the Charts & Report tab expanded.
Related Links:
