![]()
Maximized Repeat Locations Widget
Overview
-
The Repeat Locations Widget in Maximized State has a number of features that are exclusive to the Maximized State.
Repeat Locations Widget in Maximized State

Identify Tool
-
One aspect of the Maximized State which is not available in the Minimized State is the identify tool.
-
With this tool it is possible to add repeat locations to a selection set which can then be filtered using reports and charts.
-
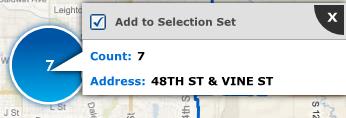
Click on one of the graduated symbols that represent a repeat location to open the identify tool.
-
The number of features or events occurring at this location is provided as well as the address of the repeat location.
-
Add the repeat location to a selection set by using the Add to Selection Set check box.
-
As repeat locations are added to a selection set, the color of the repeat location symbol changes.
Identify Tool
-
You will notice the Print icon in the top left corner of the map.
-
Clicking on this icon will bring up the Repeat Locations Printing Options.
-
The Include Map check box will print the map.
-
The Include Summary check box will print the summary of the repeat locations. This will be a list of each address along with the count.
-
The Include Widget information check box will print such information as the query the widget is built upon.
-
You can enter a Title and a Description in their respective fields.
-
If you have used the Charts and Report tab to filter the results, you can also print Charts and/or a Report.
-
The Include Charts check box will allow you to print Charts. You can print any combination of an Incidents Chart, Day of Week chart or a Time of Day chart.
-
The Include Report check box will allow you to include a Report. You can pick the fields to include in the Select Fields to Include box.
-
The Clear All button will allow you to reset your printing options back to default.
-
Click the Print button to Print. A standard windows print dialogue box will then come up allowing you to choose your printer and paper options.
-
Click cancel to cancel printing.
The Repeat Locations Printing Options Dialogue Box.

Base Map Options
-
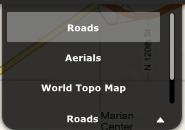
You can change the base map type using the drop down menu in the top right corner of the map.
-
The choices you see will depend upon your Dashboard's configuration.
Base Layer Drop Down
Summary Tab
-
The Summary Tab displays the same information as the Table of Results tab from the Minimized State.
-
The repeat location address is in one column while the count is in the next column.
-
You can use the check box next to the repeat location address to highlight that location on the map.
-
You can export the Summary by clicking the Export Summary button. This will allow you to save the Summary as an Excel spreadsheet to your computer.
Repeat Locations Widget in Maximized State with the Charts & Report tab expanded.

Report Tab
-
The report tab will display detailed information about the incidents at each repeat location.
-
You can expand the repeat location by clicking on the arrow.
-
When expanded all incidents at the location will be detailed.
-
You can view information about each incident such as Call Type, Address, Comments, Report Date, etc.
Report View Dialogue Box

Charts Tab
-
The Charts Tab will let you view charts of the selected data.
-
The first chart is a Day of Week chart. You can see the number of incidents per day in this chart.
-
The next chart is the Time of Day chart. You can see the number of incidents per time of day on this chart.
Charts View Dialogue Box

Related Links:
© Copyright 2011 The Omega Group. All Rights Reserved.